

B2B Analytics Metrics That Expose Margin Leaks
B2B Analytics Metrics That Expose Margin Leaks
Hidden margin leaks rarely appear in standard reports at the moment they start.
They build quietly across sourcing, production, logistics, and customer service.
By the time finance sees the damage, profitability is already weaker.
That is where B2B Analytics becomes useful in a very practical way.
It connects commercial, operational, and quality data to expose value loss that traditional dashboards miss.
In complex industrial sectors, this matters even more.
For semiconductor, power device, and sensory-infrastructure programs, a small margin gap can scale into a strategic issue.
A pricing error, yield drift, gas purity variance, or return trend may look isolated.
Across hundreds of accounts and parts, it becomes a hidden profit drain.
The stronger signal is not revenue growth alone.
It is whether each order, product family, and customer relationship still earns the margin expected.
Why Margin Leaks Stay Hidden
Most companies track revenue, gross margin, and on-time delivery.
Those are necessary, but they are too broad for procurement and cost control decisions.
B2B Analytics looks deeper into transaction-level patterns.
It asks where margin changes first, why they change, and which process owns the loss.
In technical supply chains, leaks often come from disconnected systems.
Sales may discount to secure volume.
Operations may absorb rework costs.
Procurement may accept expedite fees to protect continuity.
Quality may contain failures before they reach customers.
Each team solves a local problem, while total margin slips.
This also explains why procurement teams need better visibility before renegotiating contracts or shifting suppliers.
Core B2B Analytics Metrics to Watch
The right metrics should isolate margin loss at the point it starts.
They also need to support supplier reviews, pricing decisions, and account prioritization.
1. Price Realization by Customer and Product
This measures actual selling price against approved target price.
It reveals discount creep, rebate overuse, and contract leakage.
In B2B Analytics, price realization is often the first warning sign.
For example, high-volume SiC components may show stable revenue but falling realized margin.
The issue may come from special terms that never expired.
2. Cost-to-Serve by Account
Some accounts look profitable until service costs are included.
Engineering support, split shipments, urgent change orders, and custom compliance reporting all add cost.
B2B Analytics should allocate those costs to the account level.
That changes procurement strategy fast.
An account with premium volume may actually consume the most margin through support intensity.
3. Yield Loss and Rework Cost
Margin leaks often begin inside production.
Yield variance, scrap, test failure, and rework hours all erode contribution margin.
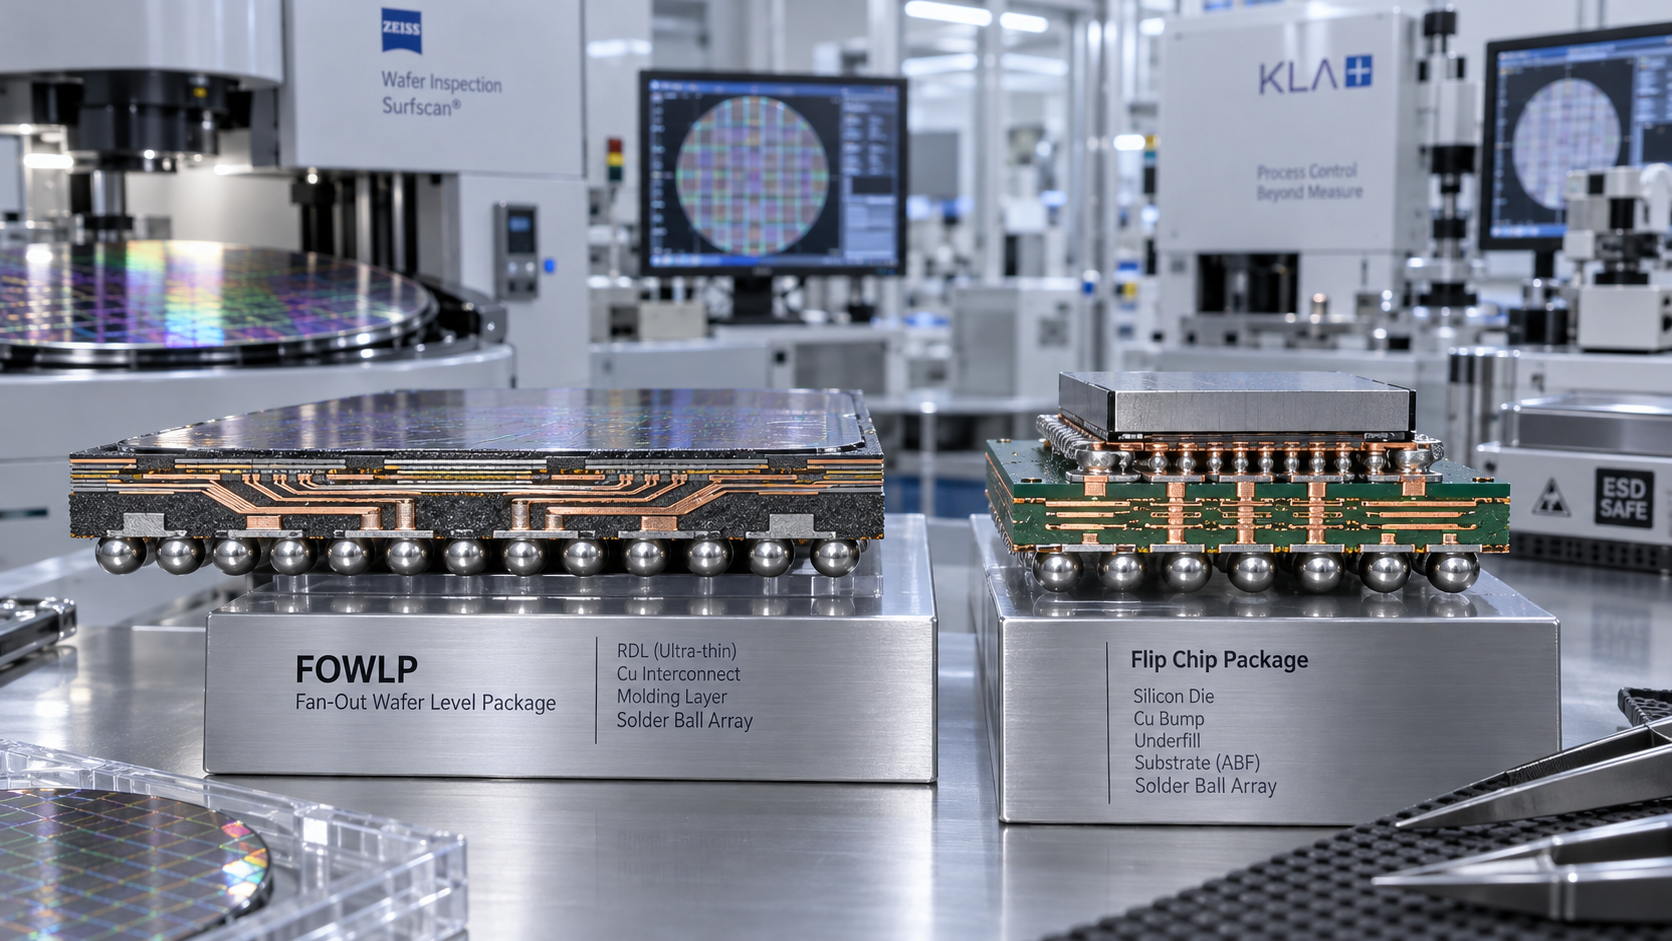
This is especially critical in advanced packaging, sensor calibration, and contamination-sensitive environments.
With B2B Analytics, leaders can trace loss by batch, tool set, supplier lot, or material category.
4. Supplier Variance Cost
The quoted price is only part of supplier economics.
Late deliveries, purity drift, packaging damage, and unstable lead times create hidden cost.
B2B Analytics should calculate variance cost beyond purchase price.
That provides a more realistic basis for sourcing decisions.
5. Warranty, Return, and Field Failure Rate
Customer-facing quality events destroy margin twice.
First through direct replacement cost.
Then through account friction, delayed renewal, or lower future pricing power.
In B2B Analytics, failure rate must connect to product family, application environment, and supplier history.
6. Forecast Accuracy and Demand Volatility Cost
Poor forecasting drives excess inventory, premium freight, and idle capacity.
Those costs usually land in different departments.
B2B Analytics combines them into a measurable demand volatility cost.
That gives procurement a stronger case for order discipline and supply agreement redesign.
How to Turn Metrics Into Procurement Decisions
Metrics alone do not stop margin erosion.
The value comes from how B2B Analytics supports action.
- Rank suppliers by total variance cost, not only unit price.
- Review customer contracts with low price realization and high service intensity.
- Separate strategic accounts from structurally unprofitable accounts.
- Tie yield loss to incoming material performance and process conditions.
- Use forecast error trends to reset safety stock and lead-time assumptions.
In practice, this moves procurement from reactive buying to margin-based sourcing.
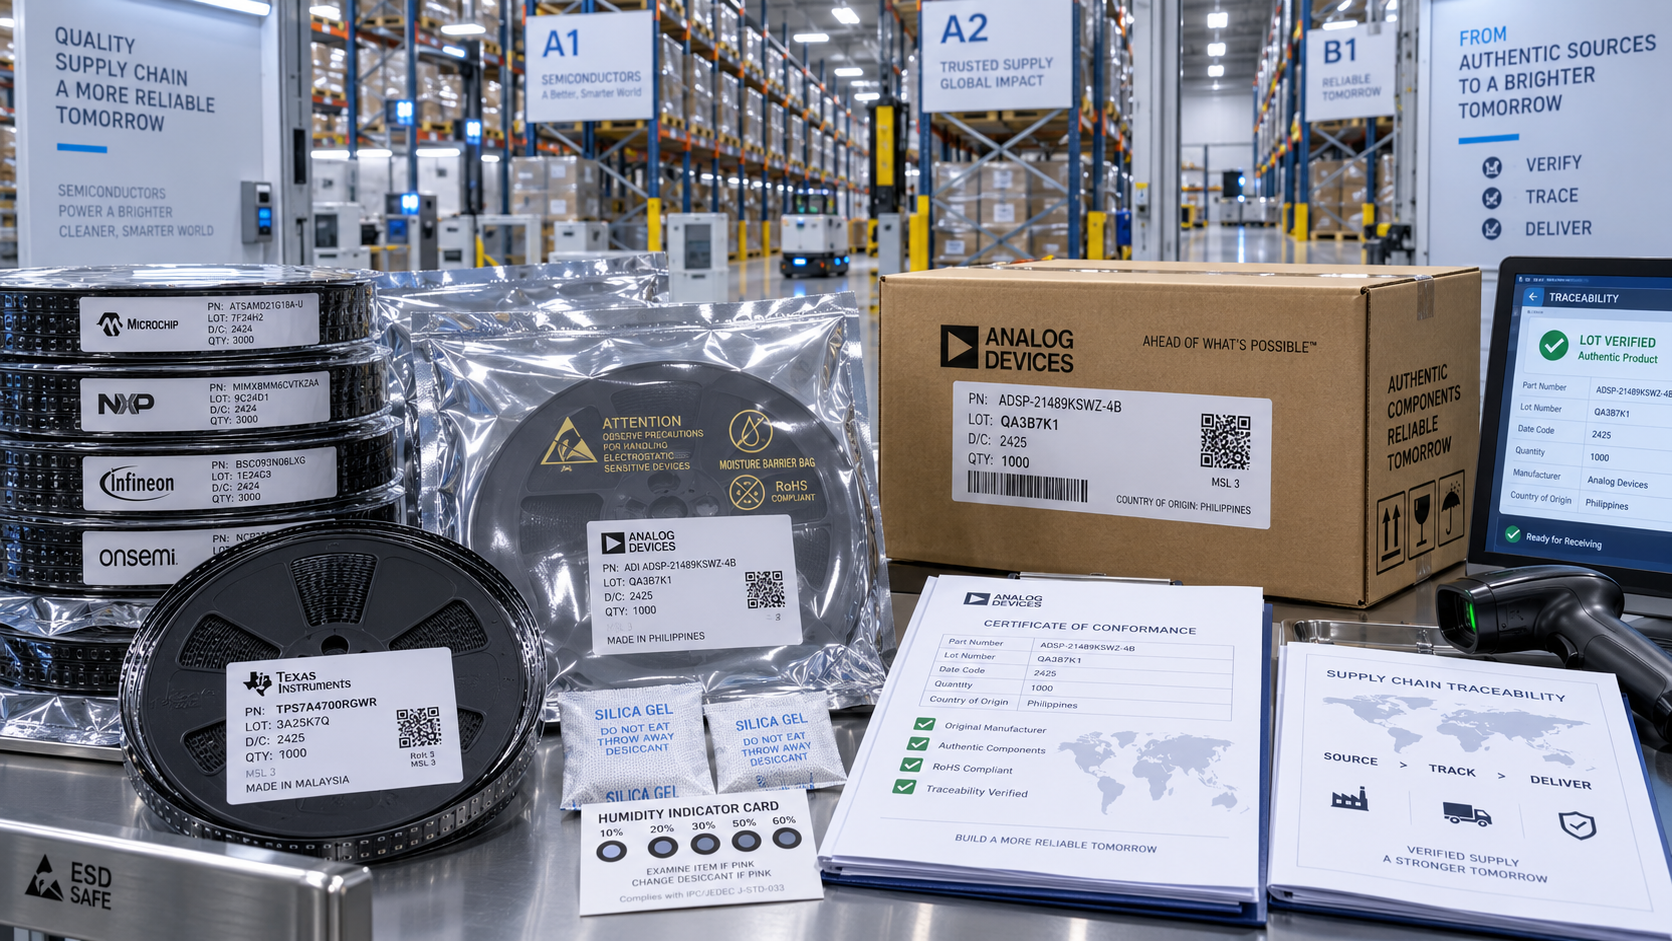
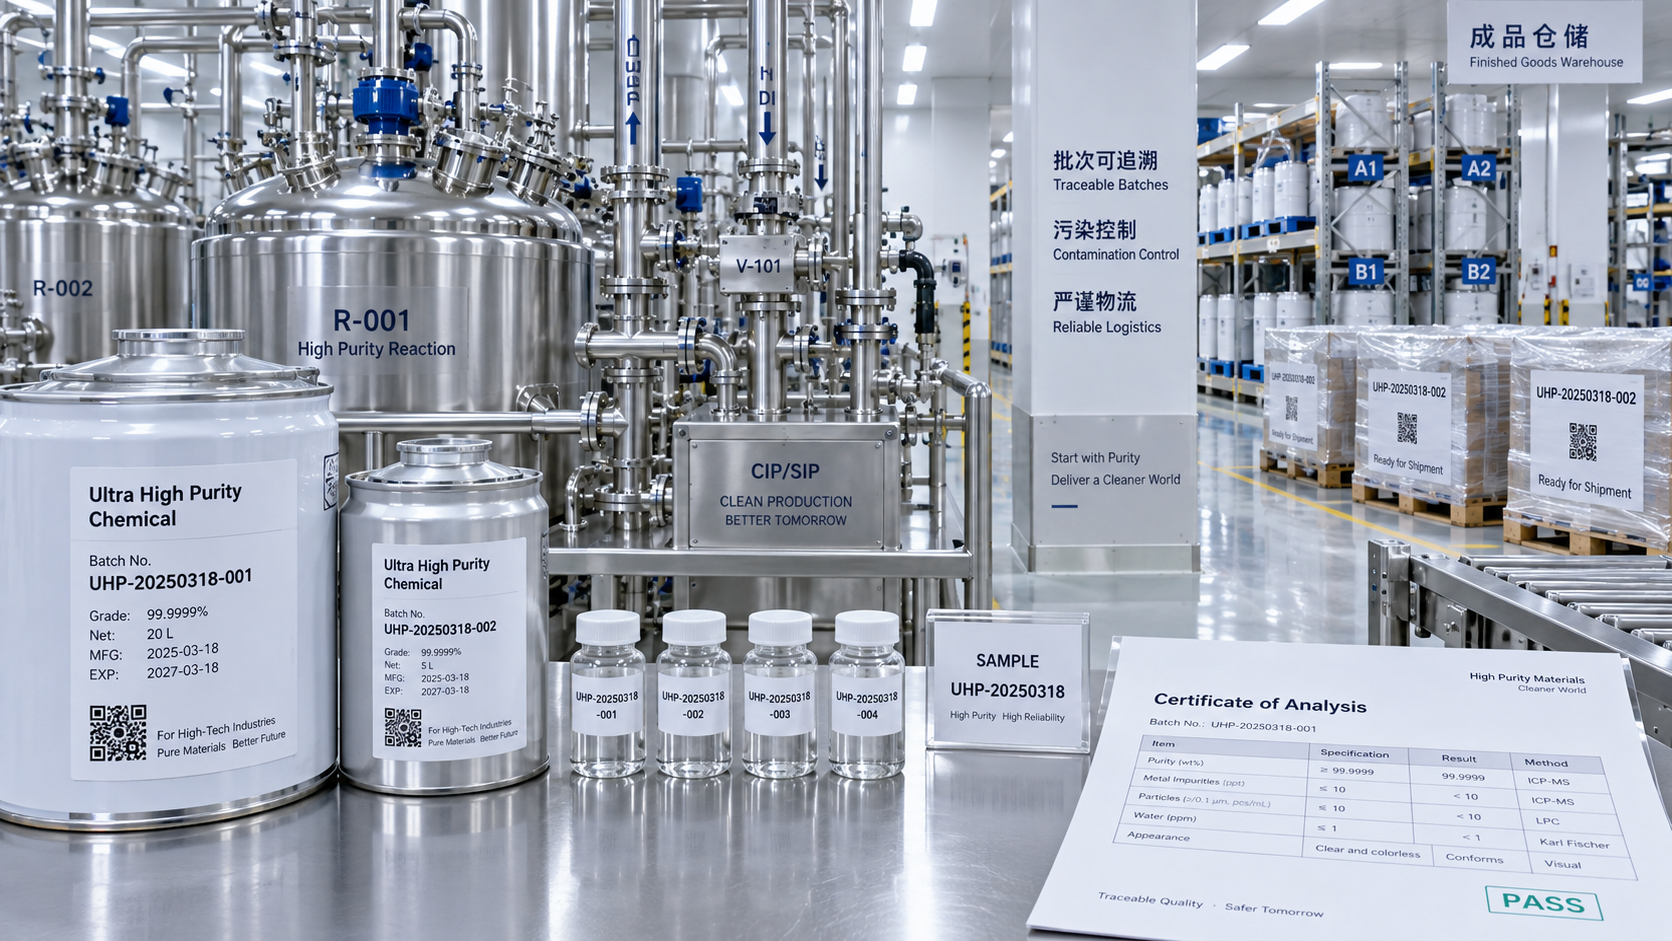
That is a stronger position when evaluating high-purity chemicals, special gases, packaging partners, or sensor subsystem suppliers.
A Simple Scorecard for B2B Analytics Reviews
A useful review model should stay simple enough for monthly decision cycles.
This kind of scorecard keeps B2B Analytics tied to cost reduction and purchasing discipline.
Where G-SSI Context Changes the Analysis
In the G-SSI landscape, margin leakage is rarely a basic pricing issue alone.
It often sits at the intersection of reliability, thermal behavior, material purity, and data fidelity.
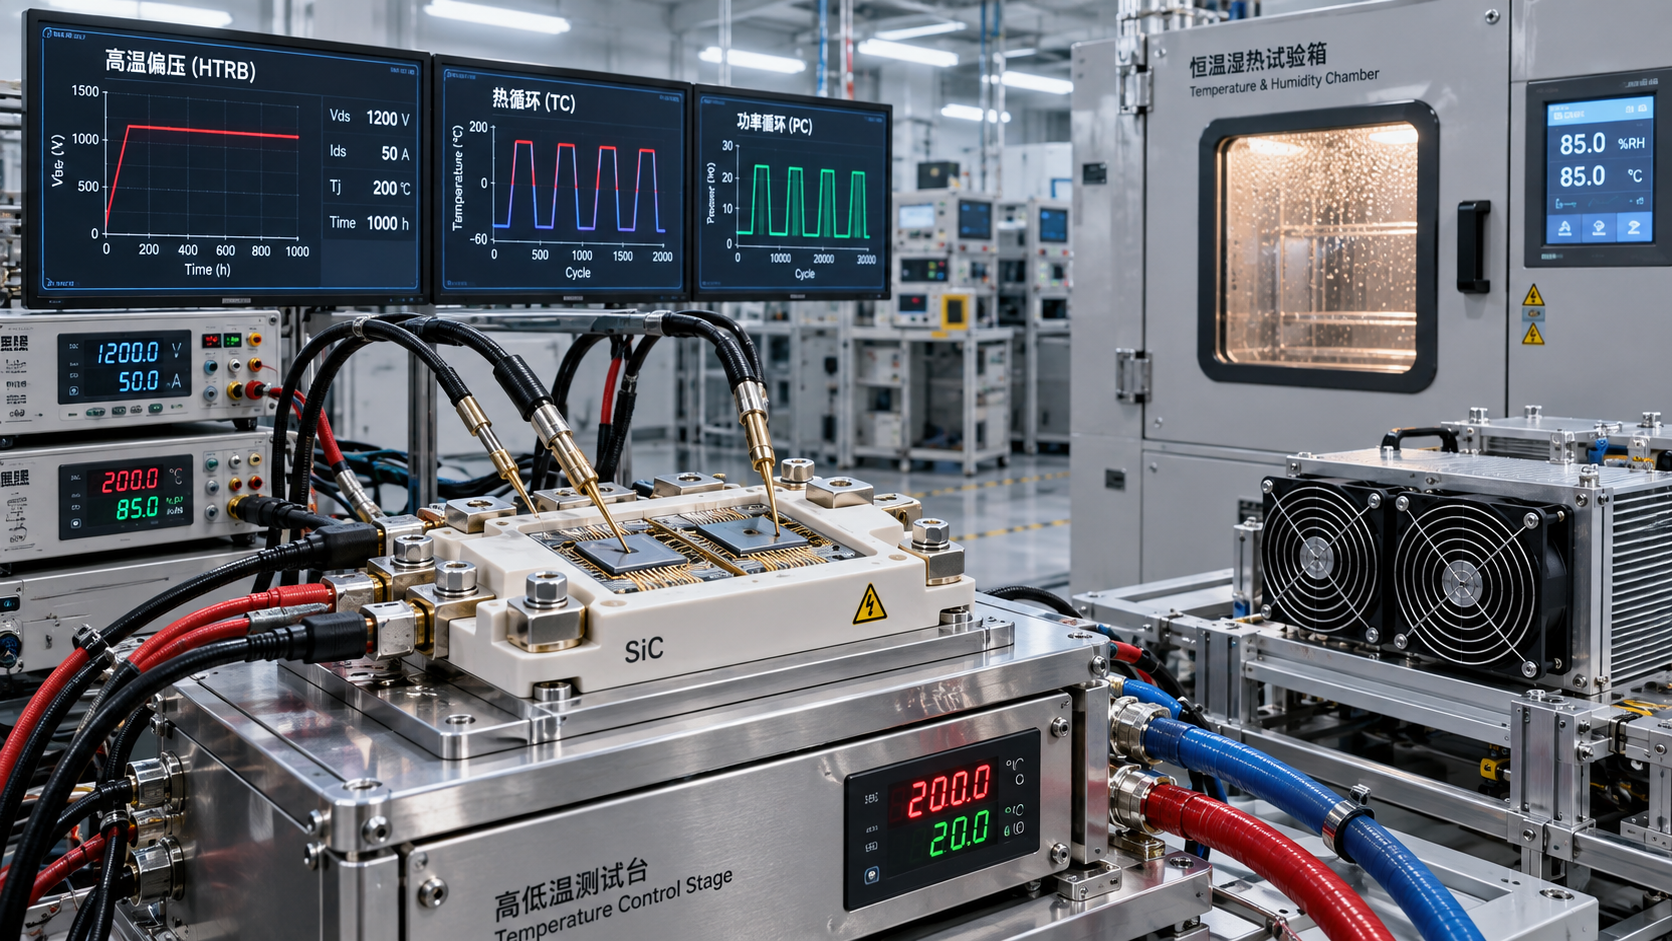
A mature-node device can still lose margin if test escapes increase.
A sensor platform can win orders but underperform if calibration support grows too expensive.
A gas supplier can look competitive until contamination events trigger yield loss.
This is why B2B Analytics should align with standards-based operational evidence.
Benchmarks linked to SEMI, AEC-Q100, and ISO/IEC 17025 make cost discussions far more defensible.
They help separate temporary issues from structural margin risk.
What to Do Next
Start with a narrow B2B Analytics scope and expand after the first savings signal appears.
- Choose one product line, one supplier group, and one account segment.
- Measure price realization, cost-to-serve, yield loss, and supplier variance cost.
- Link every metric to a monthly procurement or commercial decision.
- Review exceptions, not averages, because margin leaks usually hide in the outliers.
- Build a repeatable scorecard before scaling into enterprise-wide dashboards.
The main point is simple.
B2B Analytics is not just for reporting performance after the fact.
It is a decision tool for protecting margin before losses become normalized.
When the right metrics expose hidden cost across pricing, quality, supply, and demand, procurement decisions become sharper, faster, and far more profitable.
Get weekly intelligence in your inbox.
No noise. No sponsored content. Pure intelligence.
 Apr 28, 2026When do rapid prototyping 3D printing services save real costWhen do rapid prototyping 3D printing services save real cost
 Apr 28, 2026What Can Go Wrong in Fan-out Wafer Level Pkg?What Can Go Wrong in Fan-out Wafer Level Pkg?
 Apr 28, 2026What Makes Optical LiDAR Modules Better for Autonomy?What Makes Optical LiDAR Modules Better for Autonomy?
 Apr 28, 20262026 Market Trends in Supply Chain Resilience for Fabs2026 Market Trends in Supply Chain Resilience for Fabs
 Oct 12, 2026When does fan-out wafer level packaging outperform flip-chip packaging?When does fan-out wafer level packaging outperform flip-chip packaging?
 Oct 11, 2026How energy management can reduce peak demand chargesHow energy management can reduce peak demand charges
 Oct 10, 2026When do integrated sensor systems reduce commissioning risks?When do integrated sensor systems reduce commissioning risks?
 Oct 09, 2026How North American semiconductor fabs control airborne molecular contaminationHow North American semiconductor fabs control airborne molecular contamination
 Oct 08, 2026When do custom aluminum extrusions reduce fabrication costs?When do custom aluminum extrusions reduce fabrication costs?
 Oct 07, 2026How semiconductor packaging affects thermal reliability in EV power electronicsHow semiconductor packaging affects thermal reliability in EV power electronics
 Oct 06, 2026When do corrugated plastic boxes make sense for returnable shipping?When do corrugated plastic boxes make sense for returnable shipping?
 Oct 05, 2026What to verify before choosing semiconductor distributors in North AmericaWhat to verify before choosing semiconductor distributors in North America
 Oct 04, 2026How to assess a high purity materials manufacturer’s traceabilityHow to assess a high purity materials manufacturer’s traceability
 Oct 03, 2026How SiC power conversion solutions improve high-voltage invertersHow SiC power conversion solutions improve high-voltage inverters
 Oct 02, 2026When do SiC MOSFET benefits justify the higher device cost?When do SiC MOSFET benefits justify the higher device cost?
 Oct 01, 2026Which semiconductor reliability testing standards apply to power devices?Which semiconductor reliability testing standards apply to power devices?
 Sep 30, 2026How to qualify a semiconductor photoresist supplier for KrF/ArF productionHow to qualify a semiconductor photoresist supplier for KrF/ArF production
 Sep 29, 2026What image quality should portable ultrasound scanners deliver for triage?What image quality should portable ultrasound scanners deliver for triage?
 Sep 28, 2026How sub-ppb impurity control gases protect process consistencyHow sub-ppb impurity control gases protect process consistency
 Sep 27, 2026How chemical purity affects defect rates in semiconductor depositionHow chemical purity affects defect rates in semiconductor deposition
 Sep 26, 2026When do high voltage power semiconductor devices need SiC over IGBTs?When do high voltage power semiconductor devices need SiC over IGBTs?
 Sep 25, 2026How to verify quality controls at a die casting parts supplier in ChinaHow to verify quality controls at a die casting parts supplier in China
 Sep 24, 2026How to verify electronic gas purity for sub-ppb semiconductor processesHow to verify electronic gas purity for sub-ppb semiconductor processes
 Sep 23, 2026When sensory data integration improves industrial motion monitoringWhen sensory data integration improves industrial motion monitoring
 Sep 22, 2026How supply chain resilience reduces the cost of production disruptionsHow supply chain resilience reduces the cost of production disruptions
 Sep 21, 2026What autonomous systems OEMs should verify before sourcing LiDAR modulesWhat autonomous systems OEMs should verify before sourcing LiDAR modules
 Sep 20, 2026How gas purity affects defect density in epitaxial wafer growthHow gas purity affects defect density in epitaxial wafer growth